Tongzhou District Mayor Visits Beijing Daily AR Meeting Room Record Investment Sub-center Must Read
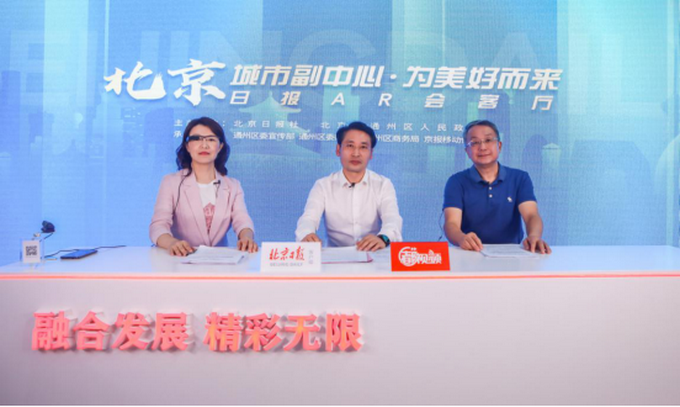
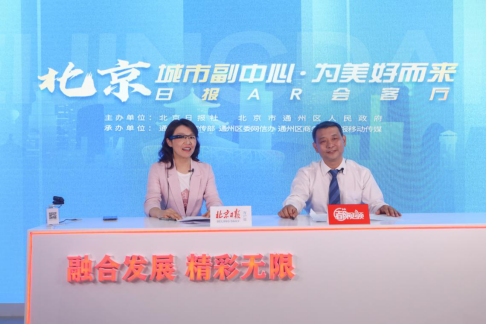
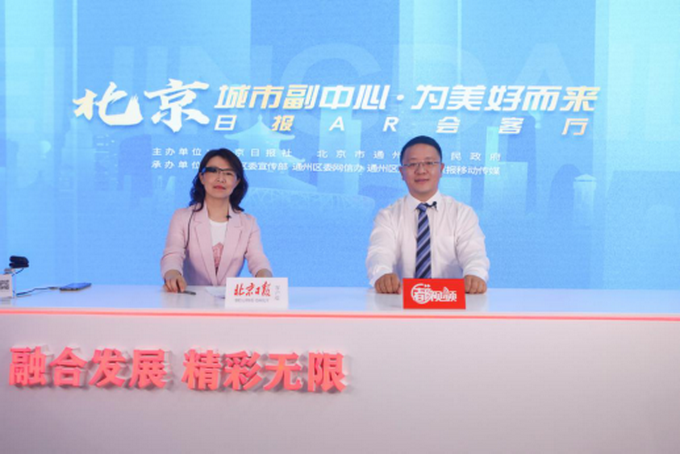
Service Trade Fair Beijing Daily AR Meeting Room
The following is a live record.
Historical Humanism: Tongzhou has a rich heritage.
As the deputy secretary of the Party Working Committee of the City Sub-center, the deputy director of the Management Committee, and the head of Tongzhou District People’s Government, Zhao Lei talked about the places where he worked and lived.
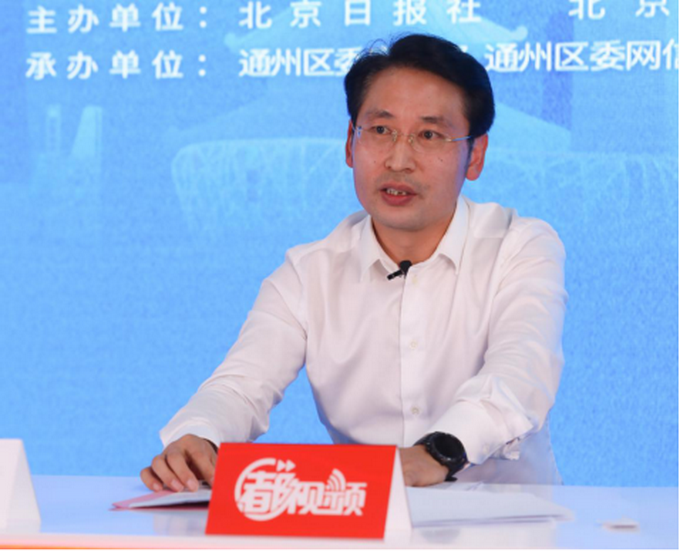
Zhao Lei was interviewed in the living room.
Tongzhou county has a history of more than 2,200 years. As the northern starting point of the Beijing-Hangzhou Grand Canal, it has a history of water transportation for thousands of years. It was once a treasure-house for communication between the north and the south, hub of the world’s wealth and exchange of cultures.
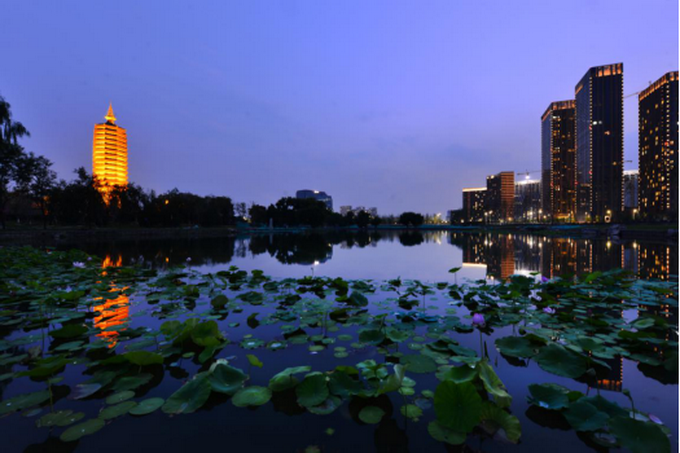
Night shot burning Buddha stupa photographer Chen Kaiyu
As the saying goes, "a tower shadow recognizes Tongzhou", the burning Buddha stupa with a history of 1400 years is located at the intersection of five rivers in Tongzhou, which is a very famous historical relic on the Grand Canal cultural belt. Other places of interest such as Sanjiao Temple and Daguanglou, as well as intangible cultural heritages such as filigree inlay, boatman’s horn and bone carving art, are direct manifestations of profound historical and cultural heritage.
In addition, Tongzhou has produced many famous people, such as Li Zhuowu and Cao Xueqin in ancient times, Liu Shaotang, Feng Qiyong, Han Meilin and Huang Yongyu in contemporary times, all of whom have grown up or rooted in this land, and it is no exaggeration to say that they are "outstanding people".
Geographical location: cultural tourism is booming.
At the scene of AR meeting room of Beijing Daily of the International Trade Fair, Zhao Lei also introduced two remarkable geographical advantages of Tongzhou in developing cultural tourism and commerce from the perspective of the International Trade Fair.
西距CBD13公里、天安门20公里,北距首都机场13公里;
南距大兴机场40公里
东距天津塘沽港100公里;
距雄安新区100公里;
与河北省“北三县”及天津市武清区毗邻,处于京津冀协同发展的桥头堡和前沿阵地……
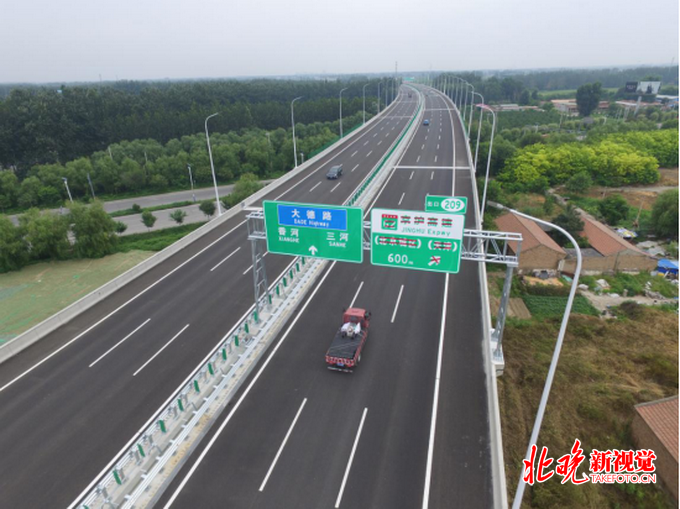
高速大七环 通州至大兴段 作者:甘南/北晚新视觉供图
通州区内的京通、京哈、京秦、广渠路东延等多条高速路、快速路以及地铁八通线、6号线、新开通的7号线东延、八通线南延等多条轨道交通把通州和中心城、机场及周边区域紧密联系在一起。
千年大计 副中心要这么建!
赵磊介绍:对于通州人来说,进入副中心时代是非常值得骄傲的一件大事。建设城市副中心是以最高领袖同志为核心的党中央着眼京津冀协同发展做出的重大战略部署,是千年大计、国家大事。2017年2月24日、2019年1月8日,最高领袖总书记先后两次到副中心视察、指导工作,并作出了一系列重要指示。北京市委市政府主要领导亲自挂帅、靠前指挥,集中全市各类优质资源,大力推动城市副中心建设,现在副中心的城市框架已经有序拉开。
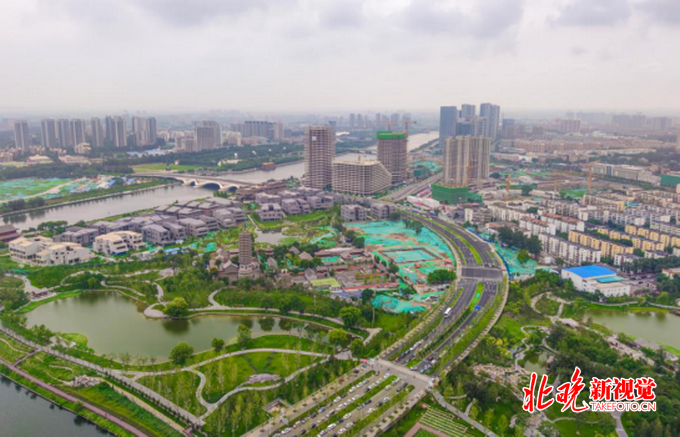
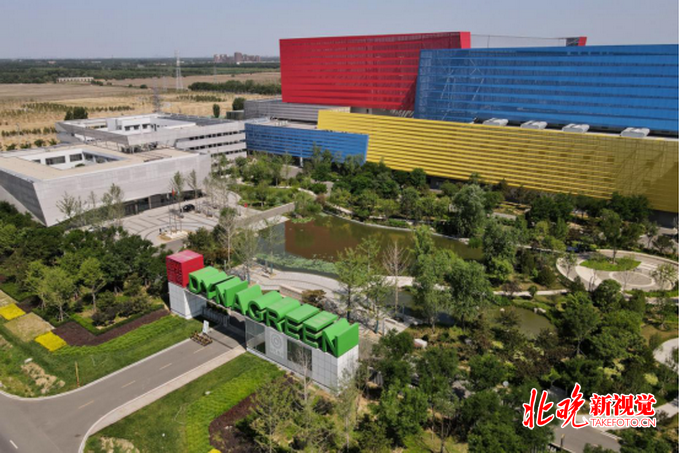
Canal business district green CBD photography Wu Yibin
In accordance with the spirit of the important instructions of the General Secretary, the construction of city sub-centers should always adhere to the world vision, international standards, China characteristics and high-point positioning, so as to create a world-class demonstration zone of harmonious and livable capital, a new urbanization demonstration zone and a Beijing-Tianjin-Hebei regional coordinated development demonstration zone with the spirit of creating history and pursuing art, the most advanced concepts, the highest standards and the best quality.
Counting sub-centers is good: software and hardware should be grasped.
When talking about the development of Beijing City Sub-center, Zhao Lei introduced that the Sub-center adheres to one node every year and has new changes every year.
The construction of Beijing Universal Theme Park is speeding up and will officially open next year to welcome guests.
The sub-center ecological landmark, the Urban Green Heart Forest Park, will open at the end of this month to welcome the public. The first phase of opening is equivalent to the size of 1.8 Summer Palace.
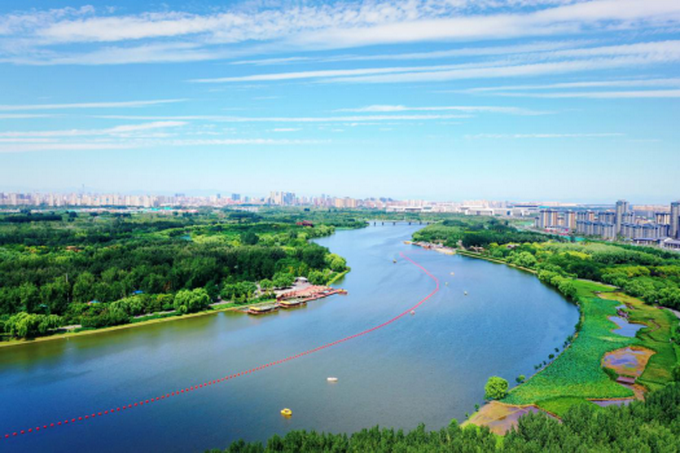
Aerial photography sub-center grand canal green heart photography Ma Wenxiao
The eastward extension project of Guangqu Road, which many citizens are concerned about, will be completed by the end of this year. The opening of this road marks the comprehensive connection of the new artery connecting the main city and the sub-center.
In addition, a number of epoch-making major projects, such as the transformation of the East Sixth Ring Road into the ground, the comprehensive transportation hub of the Beijing City Sub-center, and the flood control project of Tongzhou Weir, are progressing in an orderly manner.
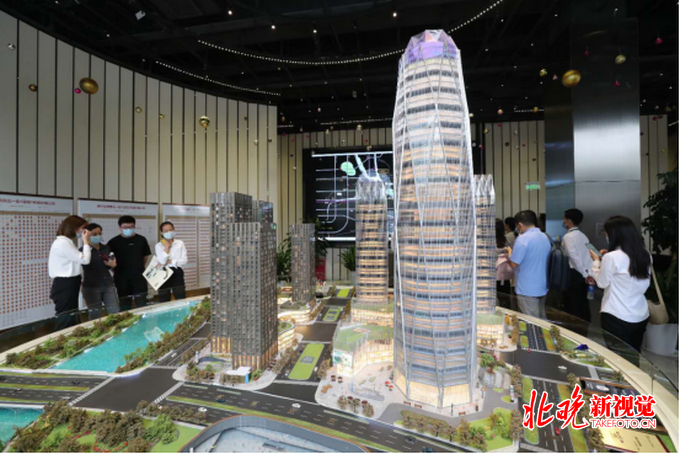
Beijing City Sub-center, like a "golden signboard", has attracted more and more attention from domestic and foreign investors. Zhao Lei took out a set of data:
This year, the fixed assets investment and Jian ‘an investment of the sub-center accounted for more than 15% and 17% of the city respectively, and the average daily investment scale was about 330 million yuan.
In the first half of this year, the number of newly established market entities in the sub-center ranked third in the city, and the registered capital and growth rate of newly established market entities ranked first in the city.
Enterprises with newly-increased registered capital of over 100 million yuan increased by 72.73% year-on-year.
The balance of deposits and loans is higher than the city average.
This year, despite the impact of COVID-19, with the joint efforts of various departments in the urban area, the sub-center has developed against the trend, with high investment enthusiasm and rising investment quality. For example, in the Canal Business District, this year, a number of enterprises have settled in, such as the Second Class Company of Three Gorges Group, Luft China Headquarters, Beijing Green Exchange, Bank of Beijing, Huaxia Bank, Beijing Rural Commercial Bank, etc. Huiquan Fund, the first licensed Public Offering of Fund management company, and Agricultural Bank Jinke, a scientific and technological subsidiary established by the first state-owned bank, have completed registration, and the sub-center has shown a good trend of accelerating the gathering of green finance and wealth management enterprises.
Package service: take multiple measures to achieve the first enterprise satisfaction in the city.
Attracting high-quality enterprises to settle in sub-centers is based on a good business environment.
Zhao Lei introduced that Tongzhou District has set up an industrial development promotion committee, and on the basis of municipal policies, it has issued eight more attractive industrial policies for sub-centers. At present, it has basically formulated and completed supporting policies in the financial sector. Under this year’s epidemic situation, the sub-center has introduced 12 new measures, and has taken the lead in building a support service platform for small and medium-sized enterprises in the city to help enterprises tide over the difficulties.
Photographer Wu Yibin, the CBD—— of Beijing City Sub-center —— Canal Business District
In addition, in terms of government services, a "zero distance" enterprise service platform and a "city meeting room" have been set up, and various services such as "one-line operation" and "one-day completion" have been continuously upgraded and optimized, and the municipal government affairs hall of the sub-center is also being accelerated. Service butlers are set up in different categories, and mechanisms such as regular visits by district leaders, "golden card" service for enterprises and customized service packages are established. In the latest evaluation of business environment in the city, the satisfaction of sub-center enterprises ranks first in the city.
Talking about the future: these construction goals deserve attention.
Beijing City Sub-center should be built into a demonstration area without "urban diseases". This statement from the sub-center regulation has become one of the important work goals of Tongzhou District Government. In the past two years, Tongzhou District has focused on key areas such as infrastructure, urban management, public services and ecological environment, and arranged nearly 500 major projects with an investment of more than 200 billion yuan. During the Tenth Five-Year Plan period, it is planned to arrange more than 800 key projects with an investment of more than 800 billion yuan for the construction of key areas such as infrastructure, urban management, public services and ecological environment.
At present, all the work has been carried out in an all-round way, and a convenient and efficient modern transportation system, well-functioning public services, complementary urban and rural spatial order, and a good ecological environment suitable for living and working are beginning to take shape. This has laid a solid foundation for showing the situation of "new wings" in Qi Fei as soon as possible, and for building a city in the new era.
Investment sub-center: much better.
Beijing City Sub-center is the pilot area in Beijing’s new round of comprehensive pilot project of expanding and opening up the service industry, and various pilot policies are tried first in Tongzhou District.
In addition, Tongzhou District is also the first batch of pilot commercial system reform in Beijing, the only pilot area for online approval of unified construction and sharing in Beijing, the pilot reform of investment approval of public service construction projects in Beijing, and the first batch of key cities for PPP innovation in major national municipal projects.
Last night, at the opening ceremony of the Service Trade Fair, the General Secretary of the Supreme Leader delivered an important speech. The General Secretary of the Supreme Leader said: "In order to give full play to Beijing’s leading role in the opening of China’s service industry, we will support Beijing to build a comprehensive demonstration zone for the expansion and opening up of the national service industry, increase the intensity of pioneering and testing, and explore more experiences that can be replicated and promoted; Establish a free trade pilot zone with scientific and technological innovation, service industry opening and digital economy as the main features, build a high-level open platform for the coordinated development of Beijing-Tianjin-Hebei, and drive the formation of a new pattern of higher-level reform and opening up. " Tongzhou will also seize the opportunity, continue to actively build a comprehensive pilot pilot area for expanding and opening up the service industry, accelerate the guidance of high-end resource agglomeration, and promote the comprehensive opening and development of the pilot area.
All of the above have gained comparative advantages and won development opportunities to promote the open and innovative development of Tongzhou service industry in the fields of scientific and technological information, financial services, cultural tourism, education and medical care. Zhao Lei sincerely welcomes entrepreneurs and investors to visit and invest in the sub-center through the live broadcast room of this newspaper, so as to jointly build a Millennium city in this new era.
Next step: be more open-minded and welcome guests from all directions.
In terms of "more open attitude", Tongzhou District has also made many useful attempts and explorations.. Zhao Lei introduced Tongzhou.districtIt was the first in the city to launch the "Registration of Foreign Trade Operators" for immediate completion, which became the first pilot of decentralization of acceptance authority for some entry and exit businesses in the city, completed the entry of the first joint venture bank in the region, relaxed the market access conditions for foreign-funded high-end specialized medical institutions, and realized the construction of Tongzhou Port and other projects.
Photography of Green Power Cycle Industrial Park in City Sub-center Bai Jikai
In the last round of service industry opening-up pilot work, the sub-center has made a series of achievements, including the increase of foreign-funded enterprises in the region year by year and the steady growth of total import and export trade. In the first half of this year alone, the registered capital of newly established foreign-invested enterprises in the sub-center increased by 543.61% year-on-year, and the contracted utilization of foreign capital increased by 611.31% year-on-year. This is inseparable from Beijing’s efforts to focus on the development of sub-centers.
In April, the Beijing Leading Group for Financial Services issued the Work Plan on Building an International Wealth Management Center in the Sub-center of the City with Document No.1, which clearly defined the sub-center as a "global wealth gathering place and a wealth management center with international influence", and will pilot 27 reform tasks in the frontier areas of wealth management in the sub-center, such as new financial license, legal digital currency and tax deferral of asset management products.
These efforts have accumulated advanced experience, broadened the horizon of thinking and trained the talent team for Tongzhou to promote the sound and rapid development of foreign economy at a deeper level, in a wider field and in a wider scope in the future.
As the pilot area of this round of comprehensive pilot work of expanding and opening up the service industry, the sub-center has arranged 78 key tasks of comprehensive pilot work of expanding and opening up the service industry this year, and established 18 key project libraries of expanding and opening up the service industry. In the next step, Tongzhou will also introduce more attractive policies and measures in the areas of decentralization, market access, foreign investment and industrial integration development, clarify the three-year action plan and specific task list for expanding and opening up the service industry, build more cooperation and development platforms, promote the service industry to open to the outside world at a higher level, and promote the vigorous development of new technologies, industries, formats and models in the service trade field.
Finally, Zhao Lei said that Tongzhou in history has a prosperous canal, which can rival the Great Wall. Today’s Beijing city vice-president wishes to open the door with a more open attitude and tolerance, and welcome visitors from all directions. Through this live broadcast, we hope that the audience can further understand Tongzhou today, enhance friendship, explore business opportunities and achieve mutual benefit and win-win development through the service trade fair, a high-standard and international service trading platform.
- The Green Heart Park is about to open "the biggest" and "the most China" in Universal Studios Beijing.
The cultural tourism industry is a green industry and a sunrise industry. Promoting the development of cultural tourism industry is the general trend and the development advantage of Tongzhou.
Zhao Jun was interviewed in the living room.
TongzhoudistrictZhao Jun, Director of Wenlv District Management Committeeexpress"The most concerned about the cultural tourism industry in Tongzhou is Universal Studios. Covering an area of about 169 hectares, Universal Studios Beijing is the largest Universal Studios in the world, equivalent to 2 Universal Studios Osaka and 5 Universal Studios Singapore. Universal Studios Beijing has seven theme scenic spots, among which the land of Kung Fu Panda is the only theme scenic spot in Asia. In addition, it is estimated that one-third of the visual scenes in the Global Theme Park highlight the China IP element, which is a unique feature in the world. "
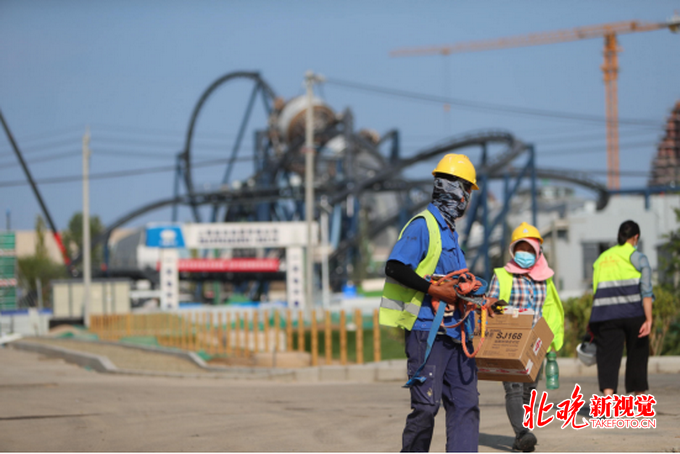
Photo Universal Studios Site Resumes Work Resumes Production Photography Gannan
Universal Studios is about to open in 2021. Can Tongzhou improve its supporting facilities and increase?addThe passenger flow of this big IP theme amusement park is also a matter of great concern to the public.In this regard, Zhao Jun said that "Tongzhou has made sufficient preparations for accommodation and transportation. According to the forecast, Universal Studios will receive more than 11 million tourists in the first year, with a peak of 15 million. According to the forecast data, there are currently 20 utility tunnel and 54 municipal roads planned in the park. In the future, the cultural tourist area will form a transportation network of "track+high speed+bus+slow travel". We are ready to welcome everyone. "
In addition, Zhao Jun said that the green heart of the city, Taihu Performing Arts Town, Zhangjiawan Ancient Town, Songzhuang Art Town and Luxian Ancient City Ruins Park are all unique representatives of cultural tourism in Tongzhou. Tongzhou will focus on top-level design and make overall plans to create a new business card that shows the cultural charm of the city’s sub-center.
- The canal business district makes the people "live and work in balance"
In Beijing, a megacity, the unbalanced development of housing and industry has made many citizens deeply troubled by the "separation of occupation and housing". Facing the booming Canal Business District, Lin Zhenghang, director of the Construction Management Committee of Tongzhou New Town Center, also gave a detailed answer to the overall planning of the Canal Business District for "separation of occupation and residence".
Lin Zhenghang was interviewed in the living room.
"The Canal Business District is the pioneer and demonstration area for the sub-center to develop high-tech industries and achieve high-quality development. The government will realize the integration of the platform through informationization, and pay attention to the construction of a balance between occupation and residence, and all-ecological commercial elements. Some existing apartments and houses in the Canal Business District will be allocated to the settled enterprises for supporting the settled enterprises’ houses, so as to ensure the balance between occupation and residence. Avoid a large number of tidal traffic commuting. Up to now, 56 enterprises have been introduced into the Canal Business District, which is developing in an orderly manner. " Lin Zhenghang said.
- Who can realize their dreams in Zhangjiawan?
Zhangjiawan Design Town focuses on urban design and gathers industries such as industrial design, cultural and creative design and artistic design, forming a design industry cluster and building an important platform to become the "design capital" of UNESCO’s creative city network.
Yu Long was interviewed in the living room.
Zhangjiawan design town is an important bearing area for the industrial development of the city’s sub-center and an important part of Tongzhou Park in Zhongguancun. Yu Long, executive deputy director of Zhongguancun Tongzhou Park Management Committee, said in an interview that "the design town adheres to high-standard planning and leads high-quality construction, and has hired design institutions such as Municipal Planning Institute, Tsinghua Tongheng, Beijing Construction Institute, China Construction Institute and Hongdu Institute to create high-quality space. This year, the design town is gradually advancing and transforming with five key plots as breakthroughs: Innovation Center, Tongniu Plot, Beipao Plot, Economic Development Park and Pearl River Plot. "
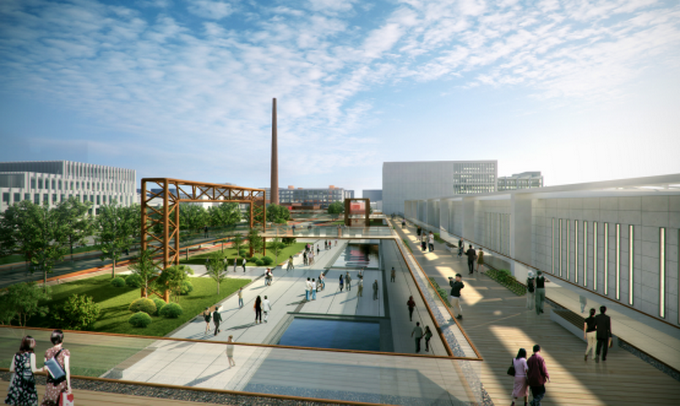
Figure design town style renderings
As for "what kind of talents can settle in Zhangjiawan Design Town", Yu Long said that "the first draft of the Interim Measures for Promoting the Industrial Development of Zhangjiawan Design Town has been completed, and well-known design masters and institutions at home and abroad are encouraged to gather and develop in the design town, encourage new enterprises to grow and develop, and encourage existing enterprises to become bigger, stronger and more innovative. Since 2020, the design town has undertaken 87 municipal enterprises, including architectural design, cultural design and other design fields, as well as urban science and technology industries such as big data, artificial intelligence and Internet. There are also a number of design head enterprises that are focusing on communication and strive to settle in design towns during the year. "
- Practicing Media Convergence: Beijing Daily’s New Equipment at the Service Trade Fair
As a highlight of Beijing Daily’s participation in the service trade fair, AR smart glasses jointly developed by this newspaper made its debut in this live interview. By wearing AR smart glasses, the host and location reporters interspersed the "first perspective" screen in the live broadcast, bringing a new live broadcast experience to netizens.
Yan Xiaogang, deputy editor-in-chief of Beijing Daily, introduced that the AR meeting room built by Beijing Daily at the service trade fair adopted X300 AR smart glasses with independent intellectual property rights of Beijing Daily, and conducted live interviews in a brand-new way of "4K+AR".
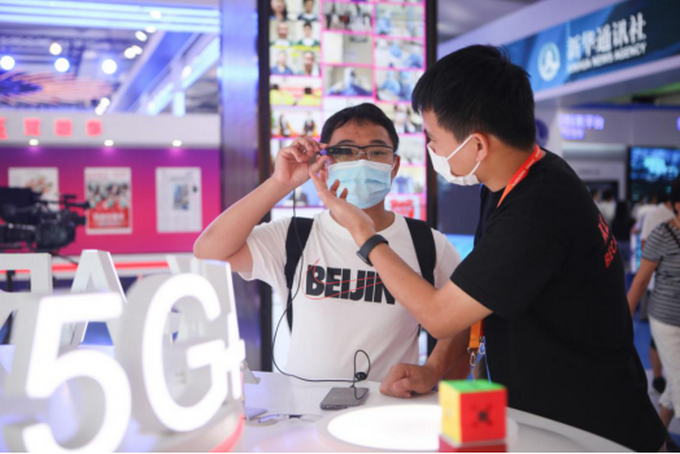
Visitors are trying on X300 AR glasses.
X300 AR smart glasses are monocular AR media-integrated smart glasses jointly developed by Beijing Daily and Xiaolong Technology, which are light, clear and high-performance. They have the functions of collection, editing and distribution, and have the functions of real-time live video connection, live broadcast, face recognition, intelligent voice conversion and voice recognition. Empower the media industry in the era of media integration and development, and help traditional journalists transform into all-media journalists.
Talking about Beijing’s new measures and policies in the fields of service, tourism and innovation in the future development of new highlands in the AR living room with a sense of the future also echoes the theme of "global service, mutual benefit and sharing" of the Trade Fair.